


Mass appraisal sales analysis isn’t easy. Outdated tools, endless manual spreadsheet tweaks, hidden market outliers, and inaccurate comp selections leave tax offices racing against valuation deadlines, while risking appeals and lost revenue. It’s time to modernize. Meet E-Ring’s CMA, the intelligent appraisal module built directly for local government assessment offices. Instantly pair subject parcels with the best neighborhood comparables using automated similarity scoring and visual fit radar charts. Catch mis-assessments before they happen. Automated outlier detection flags value discrepancies across your entire county in seconds. Track neighborhood price trends with live heatmaps, test model accuracy on held-out sales, and push updated values straight back into your CAMA system with one click.
Boost your accuracy, save hundreds of appraisal hours, and defend your tax roll with confidence. Upgrade your mass appraisal workflow with E-Ring's CMA.

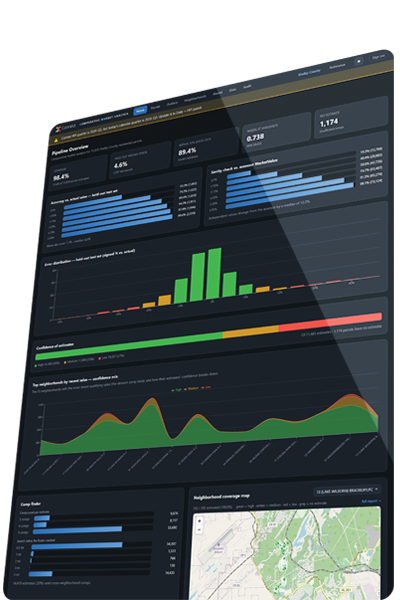
PIPELINE METRICS OVERVIEW: Displays macro statistics such as total parcel coverage rate (e.g., 98.4%), held-out median error rates, and unestimated parcel counts.
ACCURACY VS. ACTUAL SALES: Tracks error distributions on held-out test sets to validate model reliability.
MODEL CONFIDENCE METRICS: Visualizes confidence levels across estimates (categorized as High, Medium, or Low) and shows confidence breakdowns across top neighborhoods.
COMP FINDER & COVERAGE MAPS: Analyzes search radius distribution (e.g., within 0.5 miles up to 5 miles) and plots geographic coverage overlays directly on interactive maps.
NO-ESTIMATE TRACKING: Explicitly details reasons why specific parcels could not be auto-valued (e.g., insufficient nearby comparable sales or distance exceeding refusal thresholds).

PIPELINE METRICS OVERVIEW: Displays macro statistics such as total parcel coverage rate (e.g., 98.4%), held-out median error rates, and unestimated parcel counts.
ACCURACY VS. ACTUAL SALES: Tracks error distributions on held-out test sets to validate model reliability.
MODEL CONFIDENCE METRICS: Visualizes confidence levels across estimates (categorized as High, Medium, or Low) and shows confidence breakdowns across top neighborhoods.
COMP FINDER & COVERAGE MAPS: Analyzes search radius distribution (e.g., within 0.5 miles up to 5 miles) and plots geographic coverage overlays directly on interactive maps.
NO-ESTIMATE TRACKING: Explicitly details reasons why specific parcels could not be auto-valued (e.g., insufficient nearby comparable sales or distance exceeding refusal thresholds).

SUBJECT PROPERTY PROFILE: Summarizes property characteristics (GLA, lot size, year built, bedrooms, bathrooms, condition, grade, story height, etc.) alongside listing data and baseline valuations.
CMA VS. ASSESSOR VALUATION: Compares the updated CMA estimate directly against current Assessor Market Value and Land Value.
COMP FIT RADAR CHARTS: Uses spider/radar graphs to visually evaluate similarity across key metrics (GLA, age, lot size, location, story, quality) between the subject property and selected comparable sales.
ADJUSTED COMPARABLE BREAKDOWN: Provides side-by-side comparable property cards displaying itemized adjustments (time, location, GLA, condition, stories, fixtures, baseline features) to reconcile market value.
LOCATION MAPPING: Embeds parcel-level GIS maps displaying relative positions of selected comps to the subject property.
NEIGHBORHOOD SUMMARY DASHBOARD: Tracks metrics per neighborhood/market area, such as median sales price per sq. ft., sales ratio percentages, turnover rates, and total parcel counts.
DISTRIBUTION CHARTS: Visualizes age profiles, condition distributions, and sales price ranges across specific neighborhood clusters.
INTERACTIVE HEATMAPS: Displays neighborhood-level spatial coverage maps showing valuation density and sales activity.
RECENT SALES AUDIT TABLES: Lists recent neighborhood market sales with percentage variances relative to current valuations to highlight market trends.

NEIGHBORHOOD SUMMARY DASHBOARD: Tracks metrics per neighborhood/market area, such as median sales price per sq. ft., sales ratio percentages, turnover rates, and total parcel counts.
DISTRIBUTION CHARTS: Visualizes age profiles, condition distributions, and sales price ranges across specific neighborhood clusters.
INTERACTIVE HEATMAPS: Displays neighborhood-level spatial coverage maps showing valuation density and sales activity.
RECENT SALES AUDIT TABLES: Lists recent neighborhood market sales with percentage variances relative to current valuations to highlight market trends.

MIS-ASSESSMENT CANDIDATE SCREENING: Automatically identifies and flags parcels where the CMA estimate significantly diverges from the Assessor Market Value beyond set thresholds.
DEVIATION & THRESHOLD FILTERING: Allows appraisers to filter outliers by neighborhood, confidence level, or specific feature deviations (e.g., living area, age, condition, fireplaces).
EXPORTING & INTEGRATION: Offers direct export options (Export Excel or Export to CAMA) to push reviewed adjustments back into the core assessment database.


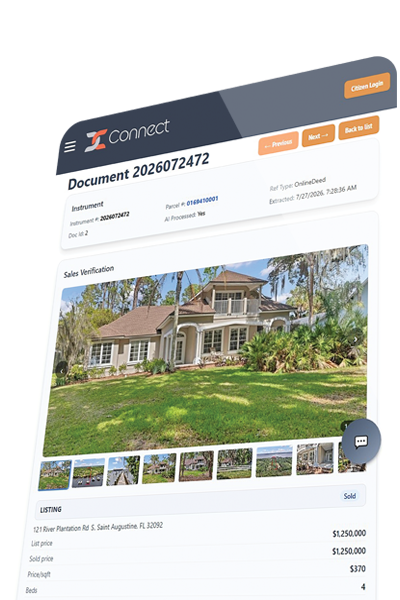
Agentic AI Based. High-Speed Deed Processing. MLS Integration. Instant Sales Verification.
AI-Based AVMs. Single-Click Error Detection. Instantaneous Comps & Comparative Market Analysis.
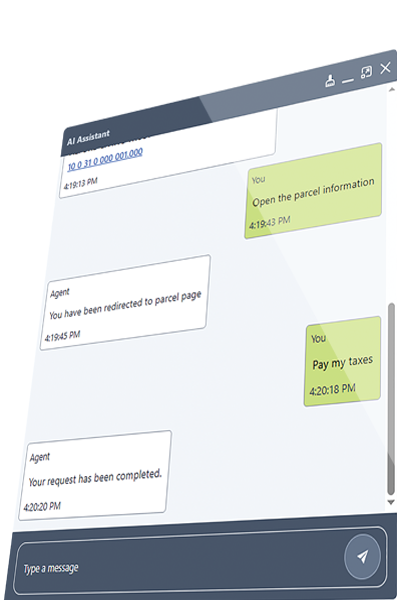
Democratize Institutional Knowledge. Works with Existing Websites. Customized Agents & Intelligent Email Replies.